
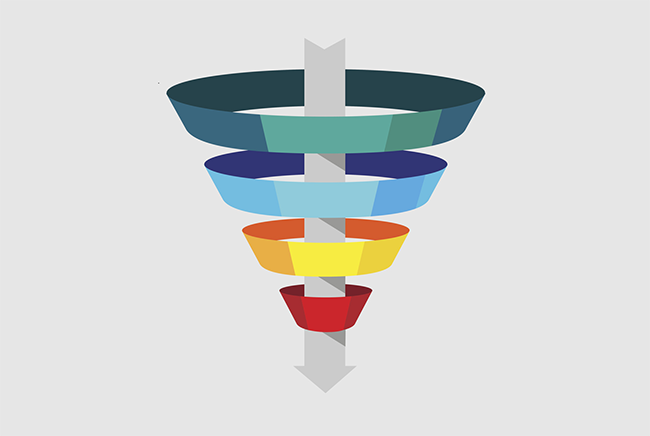
One of the most crucial things to understand in sales and marketing is funnels. Funnels are used to describe everything from how users behave on your e-commerce platform to how a sales team is working through their leads. Funnels are different than a simple data dump in that they always describe a flow of data from one state to another, usually passing a number of states or stages in between.
Visualizing a funnel helps you understand how the flow develops and where the leakages are. A bad funnel just shows you the data, great funnels give you actionable insights into how to improve the data.
Great funnels have two things in common:
- They are structured well
- They have the right metrics
Structuring a funnel
A funnel follows a logical, chronological, one-way flow from one state to another. Let’s evaluate each of the three parts:
- Logical: There must be a strict logic in the order of the stages in the flow. Why are the stages ordered like they are? This is usually not a big issue, but some people get confused when multiple things happen (near) simultaneously
- Chronological: Good funnels are always chronological. If in doubt, think of the timeline in the development! The stages that happen first are at the top of the funnel
- One-way: Flows should always strive to be one-way flows. This means that the data in the funnel should always flow from “up” to “down”. One direction. In some cases, this may be compromised, but do your best to ensure this doesn’t happen.
The order of the steps in the funnel
Think of each step in a funnel as a filter. In order for the data to go to the next stage, it has to pass through the filter. Taking a traditional email flow as an example:
- Emails sent
- …delivered
- …opened
- …clicked through
- Conversion
The order must be in this direction. You cannot click through on an email without first opening it – opening an email must, hence, be above clicking through it. Similarly, you cannot open an email that you haven’t received. You cannot receive an email that hasn’t been sent.
You can, however, open an email without clicking on any of the links. “Opening” the email must, therefore, be placed higher up in the funnel than “click-through”.
Measuring a funnel
Funnels can be looked at in two ways: Either as a way to measure output as a function of input or as a way to understand the performance of each separate stage in the flow.
When you build your funnel, it’s important to remember that there are three kinds of insights you want to gain:
- Absolute numbers
- Conversion rates
- Exit rates
For the remainder of this article, I will use the example of email flow.
| Metric | What? | Why? | How? |
| Absolute numbers | The absolute number of users in a given state. | This helps you understand the overall amount of data (and hence potential impact) you are working with and hence estimate the impact on the business. | The full number in absolute terms. |
| Conversion rate (CR) | The percentage of total users making it to that particular stage. | CR helps you understand how big a share of total users makes it to this stage. The conversion rate helps compare numbers across data samples by adjusting for the total volume of data in the sample (i.e. week on week data in an email flow where the total number of emails may differ. | This is shown as a percentage and is calculated by taking the particular stage and dividing it by the total number of users at the top of the funnel. |
| Exit rate | The percentage of users not going to the next step (i.e. leakage). | As your funnel is a multiplication chain, an increase in the conversion rate of X% at any given stage will correspond to an uplift in the total output of your funnel of X%. The exit rate is the inverse of the conversion rate at any given stage and thus highlights the leakage from your funnel. Exit rates also help you isolate the performance of an individual stage across samples. E.g. people may differ in the propensity to open an email, but do they also differ in terms of click-through rate? | Exit rates are calculated as 1 – (users in the following stage)/(users in the current stage). |
Example of a funnel
The below table depicts an example of an email funnel. Note that the table relates to a single email being sent, but can also be used if you want to depict the development week to week.
| Email flow | Emails | Conversion rate | Exit rate |
| Emails sent | 1,000 | – | 10,0% |
| Emails received | 900 | 90,0% | 44.4% |
| Emails opened | 500 | 50,0% | 60,0% |
| Emails clicked | 200 | 20,0% | 75,0% |
| Conversion | 50 | 5,0% | – |
To make a quick sanity check on the funnel, numbers should never be able to increase as you progress down the funnel. If they increase, you have most likely made a mistake in your tracking or in how you set up the funnel.
If you want to compare multiple weeks of data to get an idea of the trend, you may want to exclude the absolutes from the table. This has two benefits:
- The absolute input (i.e. top of the funnel) may differ from week to week which makes it hard to compare the absolutes on every step. Looking at the rates makes the comparison easier as they are. per definition, adjusted for the difference in size
- Having all three columns for every week makes it very hard to compare the development quickly
In those cases, remember to have a similar comparison of at least the total output week over week (and depending on your use case, also the input, e.g. emails sent), so that you know whether you are moving in the right direction and what the absolute impact is of your optimizations.
Funnels are a snapshot – consider time lag
Your funnels will always be a snapshot of the performance at any given point in time. For this reason, you cannot always conclude that the exit rates are fully representative.
If, for example, you are running a sales process where each sale may take months to close, then the difference between two steps in the funnel may not necessarily be leads who will not progress, it will simply be leads who have not progressed yet! In other words, it’s important that you keep track of those leads that have left the funnel flow and those that are still in progress.
There are two ways to think of this, both of which have their pros and cons:
- Track the “lost reasons” (see next section). When doing this, keep in mind that a lead will rarely be open forever, so do yourself a favor and put a realistic time cap on how long a lead may be unresponsive before you call it a day and mark it as “lost”.
- Filter out the leads that are still in progress by only including leads where you have either received a firm yes or no (or deemed the leads out as per the above). This works well when the open leads are distributed evenly across the funnel. If they are concentrated on one stage, simply taking the open leads out may distort your results.
Exits – understanding lost reasons
Depending on the kind of funnel you have, you may be able to track the reasons people exit your funnel. For email journeys, that may be hard to assess, but if you think of a sales funnel, then you may likely have got a response (particularly for the lower levels of the funnel) explaining why the potential customer did not want to buy.
Tracking the reasons for the exits will allow you to further improve your funnel conversion and efficiency on each step. If, for example, you can find a common denominator for a large share of your exits then you may be able to alter your pitch to cater for this particular segment or, if they for some reason will never be able to buy from you (e.g. wrong geography), then you can use this feedback to improve your lead sourcing at the top of your funnel so you do not waste time on these leads.
An area where tracking lost reasons are particularly important is recruiting. It’s important to know whether you “lose” the candidates because they get disinterested or because you decided not to proceed with them. For the former, you need to work on your pitch. For the latter, you may need to look at the candidates you are sourcing!
One or multiple funnels
On emails, for example, you may have multiple funnels. You should have one funnel per email sent. One per relevant time period (weekly or monthly).
The reason you need separate funnels per email and per week is to get comparable conversion rates – if you only look at absolutes, then you will most likely get more output from sending emails with a higher frequency. On the other hand, that may impact your conversion rates over time as people get annoyed by the increase in frequency.
If you expect the email database to grow significantly, consider having a separate funnel on your email database. That will usually include steps such as:
- Total emails
- Valid (1 – Bounced)
- Active (1 – unsubscribed)
You may have different stages if your use case permits.
For other use cases like e-commerce check-out flow, you may want to have separate funnels per marketing channel. Don’t overdo this – if you don’t have sufficient data or if the behaviour is very similar (e.g. don’t do this per keyword in Adwords), don’t bother.
How to get the most out of your funnel
A funnel is just a representation of data, what you do with that data will determine the value of the analysis. The most common aspects of funnel analysis include:
- Understand the process from lead to sale
- Detect changes in behaviour over time
- Measure the impact of individual changes to the overall output
- Knowing your exits helps identify your biggest levers for improvements
- Understanding why people exit can help you
- redesign your approach to minimize leakage from the funnel
- optimize your resource allocation to the leads most likely to convert
###
Image credits: Wordtracker, Controlstation
[mc4wp_form id=”743″]